|
|
Information Related to Pennsylvania Deep Gas Well Activity
|
|
|
|
|
|
Graphs and Statistics: Overall State Values
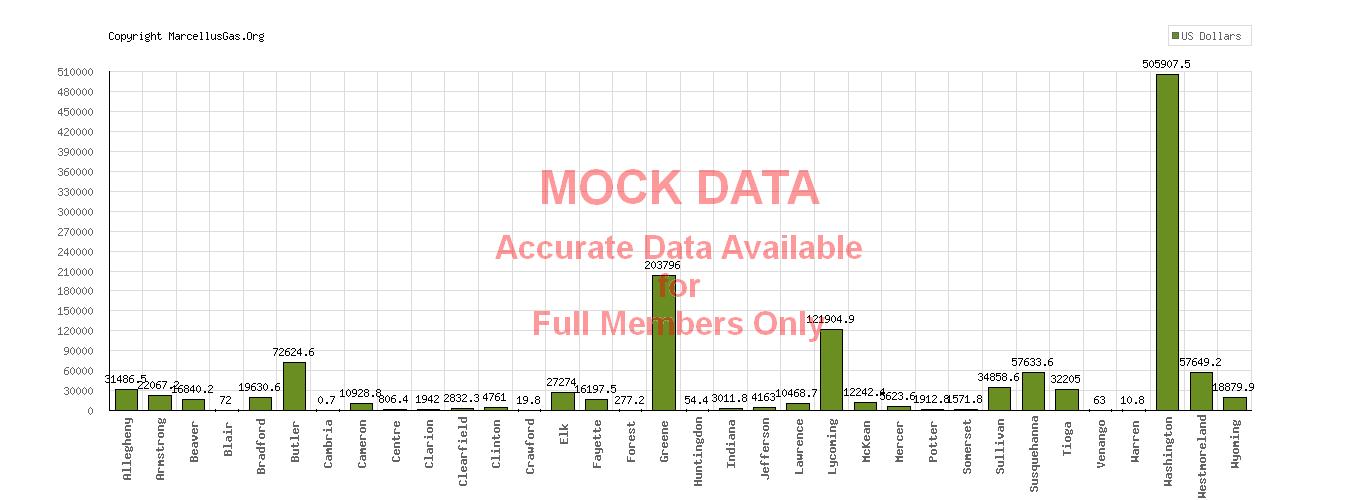
Estimated Current Royalty Income per County for the State of Pennsylvania
NOTE: estimates based on crowd sourced ATW values (view crowd sourced pricing page)
(---): estimated current royalty income for the entire state as of Apr 31st, 2026 [DEP data date: 06/18/2026].
(---) County is the county with the highest estimated current royalty income: (---) dollars.
(---) has the highest estimated current royalty income of any township in the state: (---) dollars.
Show/Hide Statistical Criteria
|
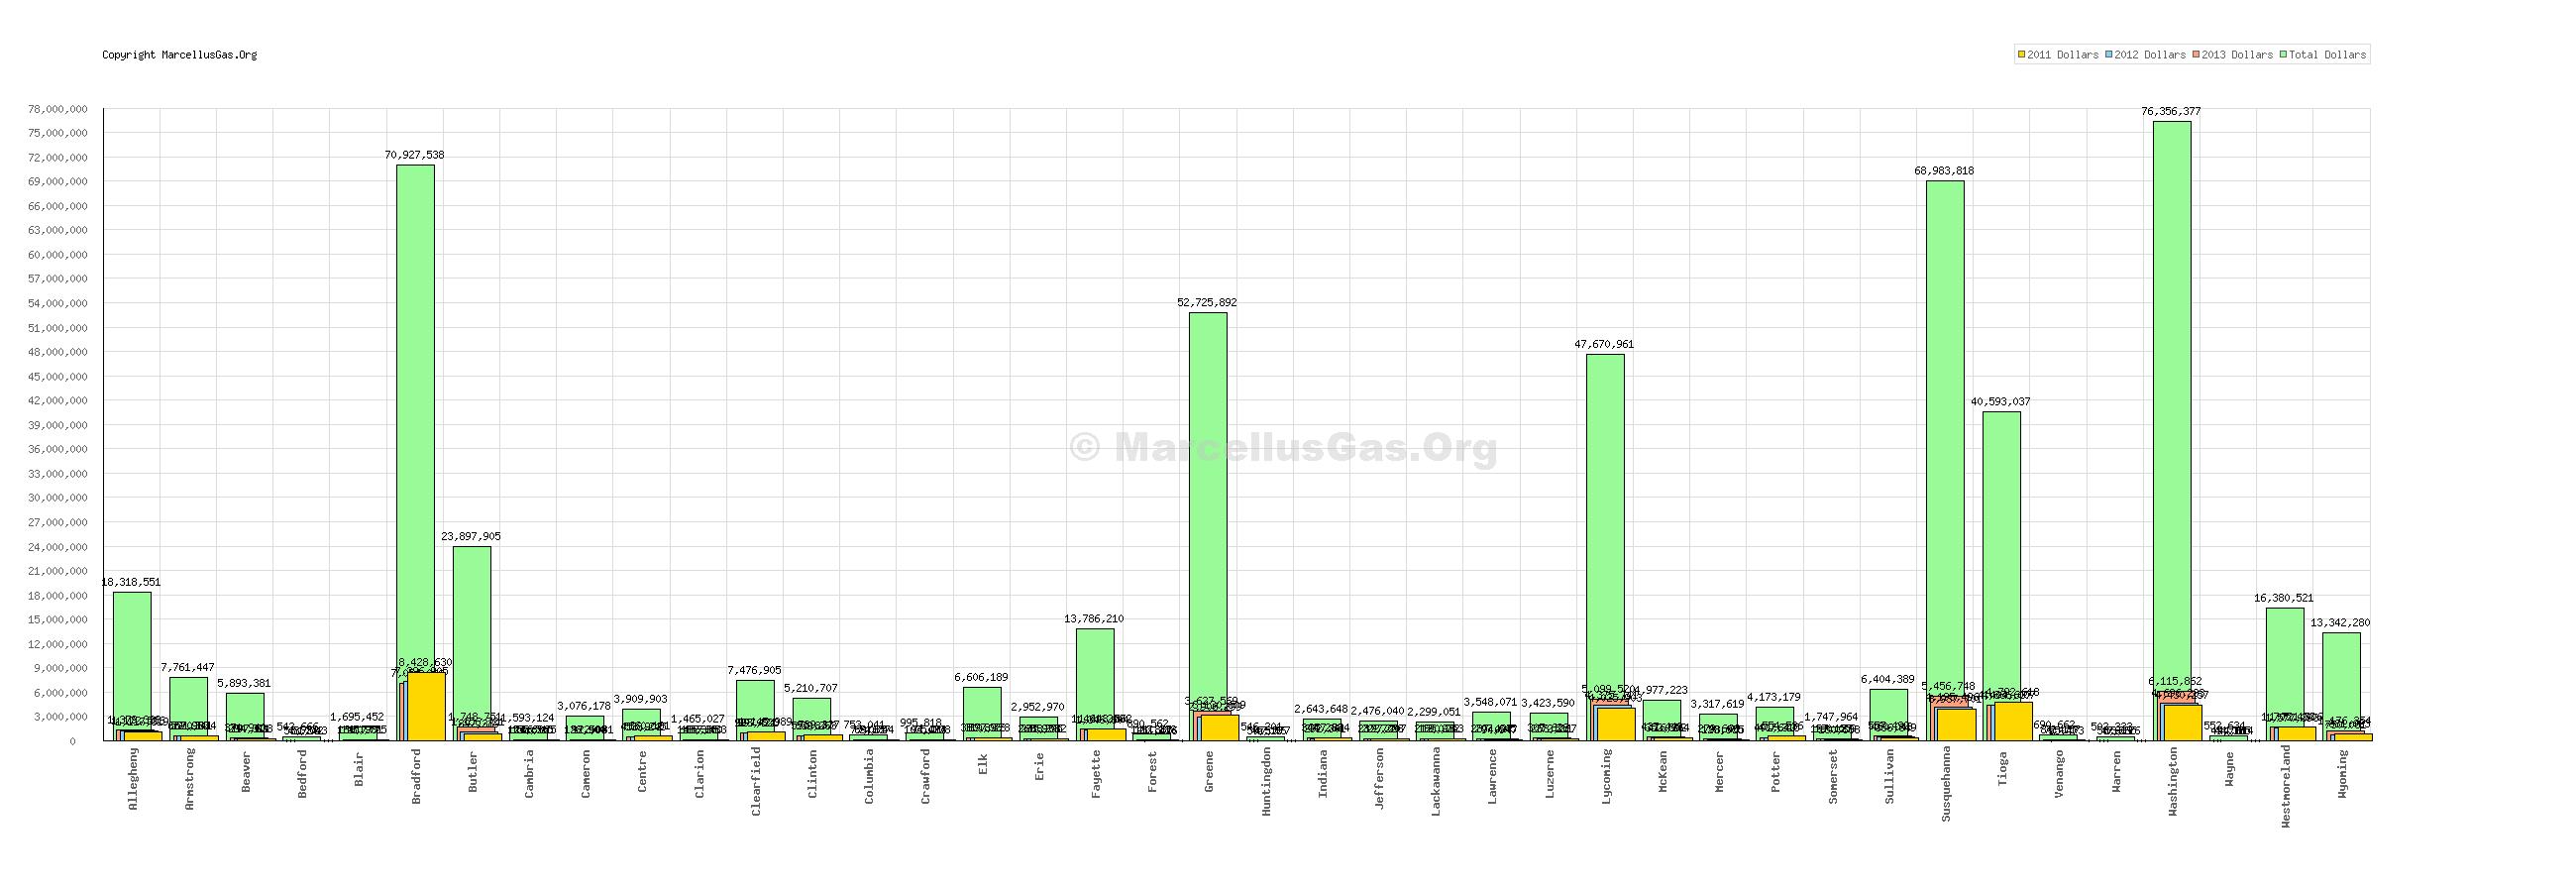
Graph: Estimated Current Royalty Income for Producing Wells per County for the State of Pennsylvania
|
|
Pennsylvania Counties in Alpabetical Order
|
Based on production data up to Apr 31st, 2026 [DEP data date: 06/18/2026]
© MarcelluGas.Org - All right reserved - Contact MarcellusGas.Org for reprint information.
|
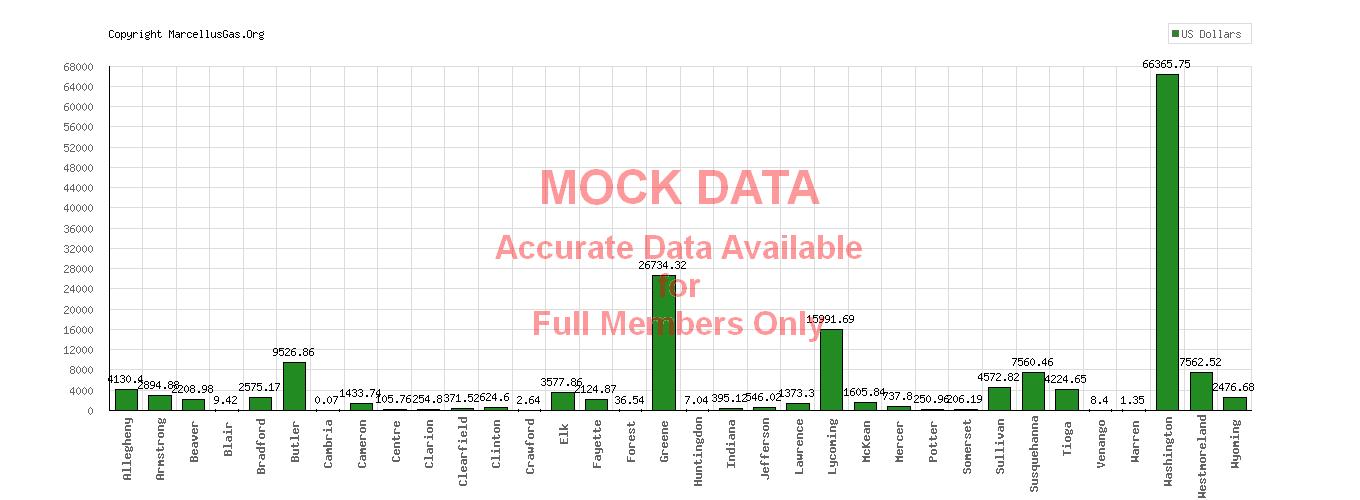
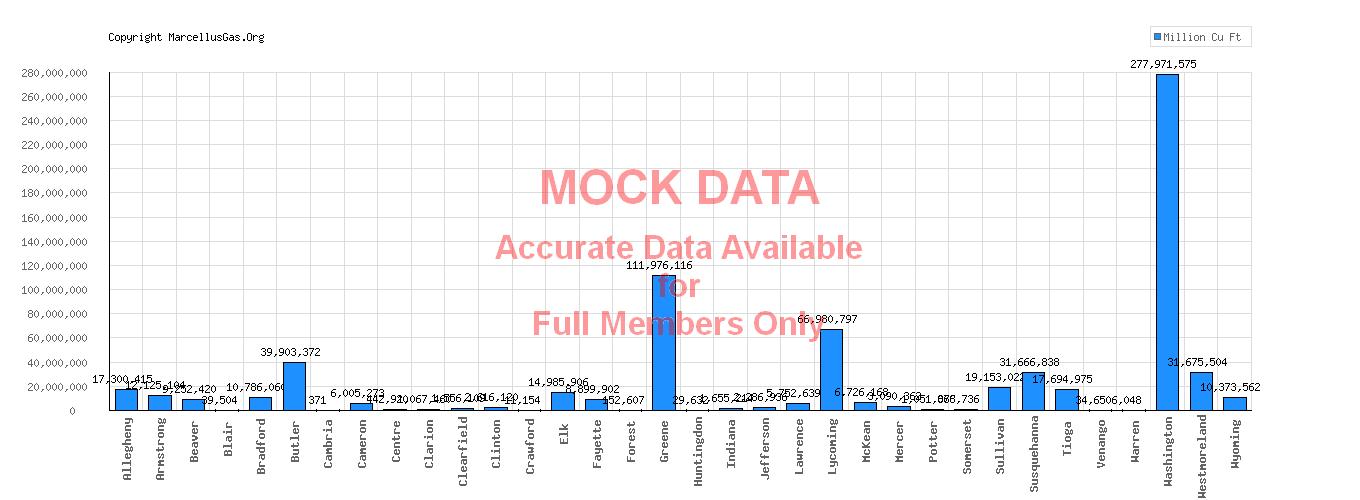
Unconventional Gas Well Production Values for the State of Pennsylvania
(---): the value of gas (yes, that's billions of dollars) produced in Pennsylvania to date, based on an adjusted total reported production volume of (---) thousand cubic feet (Mcf), and an "at the well head" (ATW) price of $ 3.34 per Mcf.
(---) dollars: the value of gas (yes, that's *billions* of dollars) produced in Pennsylvania to date, based on a residential price of $ 18.17 per Mcf.
(---): the number of homes this amount of gas would heat for a period of one year.
(---) dollars: the estimated revenue from an at the wellhead value severance tax of 5%.
County is the county with the highest ATW production values to date of dollars, based on an adjusted total reported production of Mcf. This translates to a residential pricing value of dollars, and would heat aproximately homes for one year and genearate an estimated (---) dollars in severance tax revenue at 5%.
Show/Hide Statistical Criteria
|
Graph: Wellhead ATW Dollar Value of Produced Gas per County for the State of Pennsylvania
|
|
Pennsylvania Counties in Alpabetical Order
|
Based on production data up to Apr 31st, 2026 [DEP data date: 06/18/2026]
© MarcelluGas.Org - All right reserved - Contact MarcellusGas.Org for reprint information.
|
Graph: Gas Production per County for the State of Pennsylvania
|
|
Pennsylvania Counties in Alpabetical Order
|
Based on production data up to Apr 31st, 2026 [DEP data date: 06/18/2026]
© MarcelluGas.Org - All right reserved - Contact MarcellusGas.Org for reprint information.
|
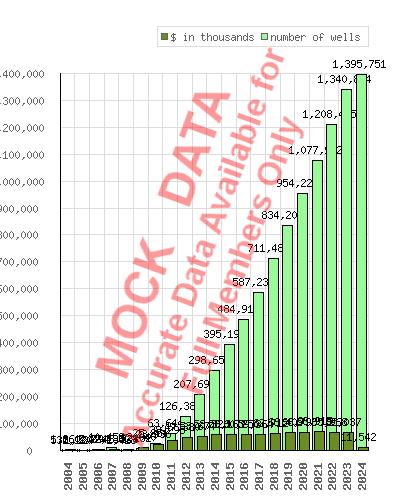
Graph: Average Production per Well, by Year, entire state of Pennsylvania
The dollar values shown below (dark green bars) represent the production average, in thousands of dollars, per well. Values are based on "At The Wellhead" (ATW) pricing of $3.34 per MCF (thousand cubic feet) - the most recent pricing figures from the U.S. Energy Information Administration. The lighter green bars represent the number of wells with reported production values during that year.
|
|
Based on most recent DEP data from Apr 31st, 2026 [DEP data date: 06/18/2026]
© MarcelluGas.Org - All right reserved - Contact MarcellusGas.Org for reprint information.
|
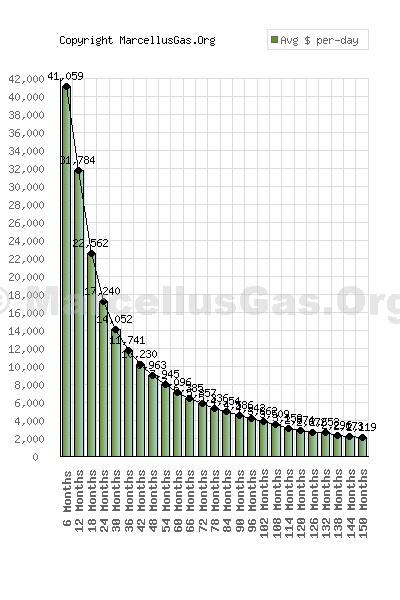
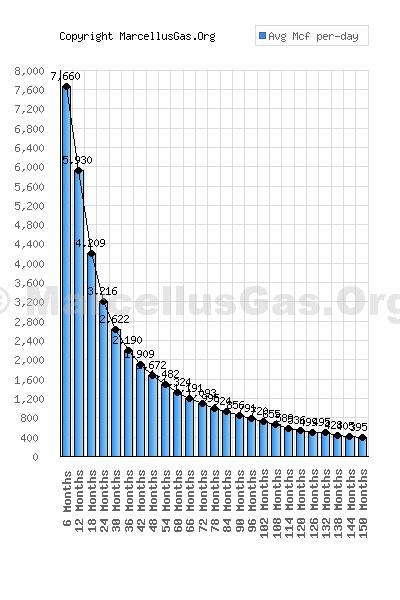
Average Per-Day Production in 6 Month Segments - entire State of Pennsylvania
The graphs below display the average per-day production values
for wells as they progress through 3 years of production.
11,089 - qualifying wells used in average per-day production calculations
95
% - percentage drop in production over 36 month period
|
Show/Hide Statistical Criteria
|
Average Per-Day Production in 6 Month Segments
|
Based on production data up to Apr 31st, 2026 [DEP data date: 06/18/2026]
© MarcelluGas.Org - All right reserved - Contact MarcellusGas.Org for reprint information.
|
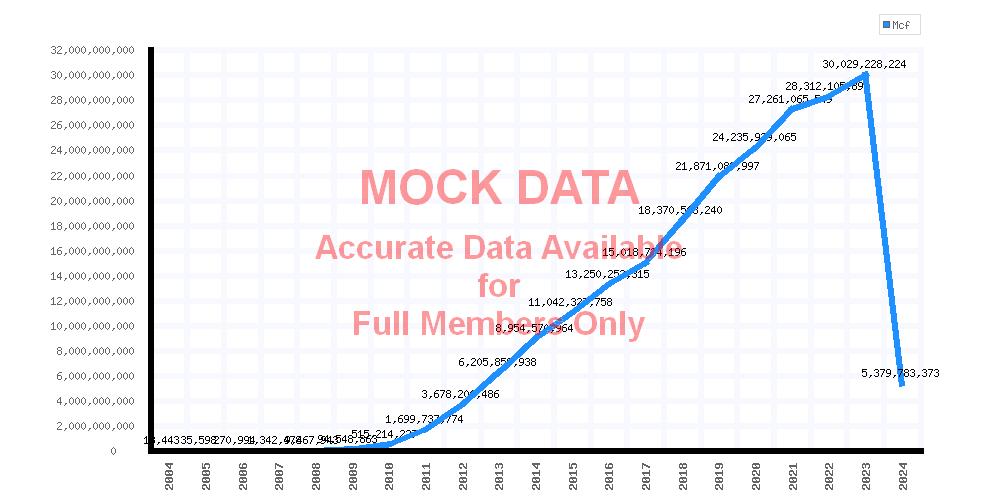
Production Per Year - Entire State of Pennsylvania
Production per year measured in thousand cubic feet (Mcf) since
the inception of unconventional wells in Pennsylvania.
|
State Production By Year (Mcf)
|
Based on production data up to Apr 31st, 2026 [DEP data date: 06/18/2026]
© MarcelluGas.Org - All right reserved - Contact MarcellusGas.Org for reprint information.
|
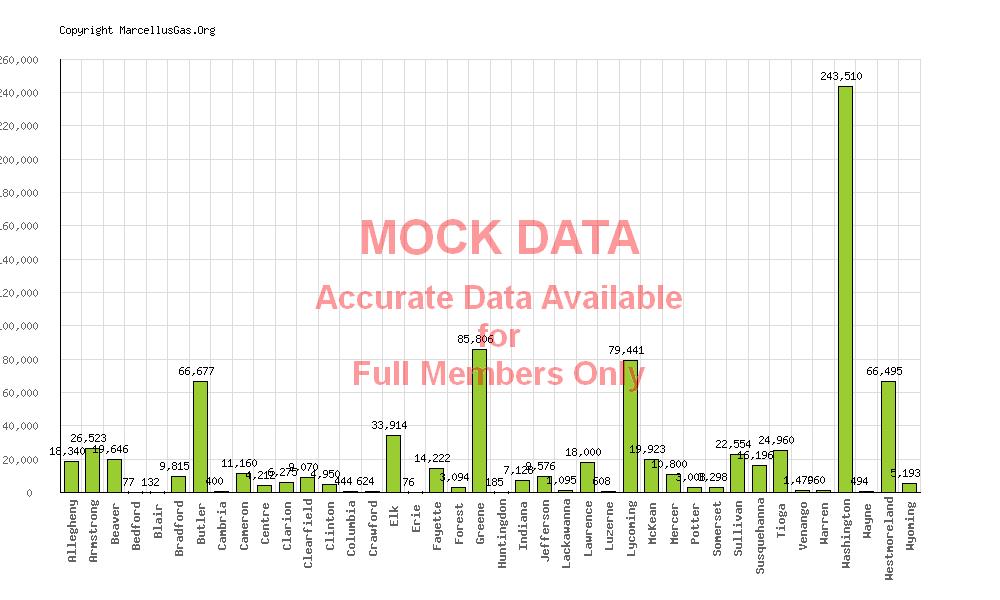
Percentage Production After 36 Months: Production Drop By County
The graph below displays the percentage of production of wells after 36 months of on-line service, by county - the values illustrate the average production drop. The number of wells sampled is displayed immediately after the county name. NOTE: these values are relative, and do not consider the gross production of the wells. To view the total production values for a given county, Click Here
Production drop is based on average per-day production values tallied in 6 month increments.
|
Percentage Production After 36 Months, By County;
|
Based on production data up to Apr 31st, 2026 [DEP data date: 06/18/2026]
© MarcelluGas.Org - All right reserved - Contact MarcellusGas.Org for reprint information.
|
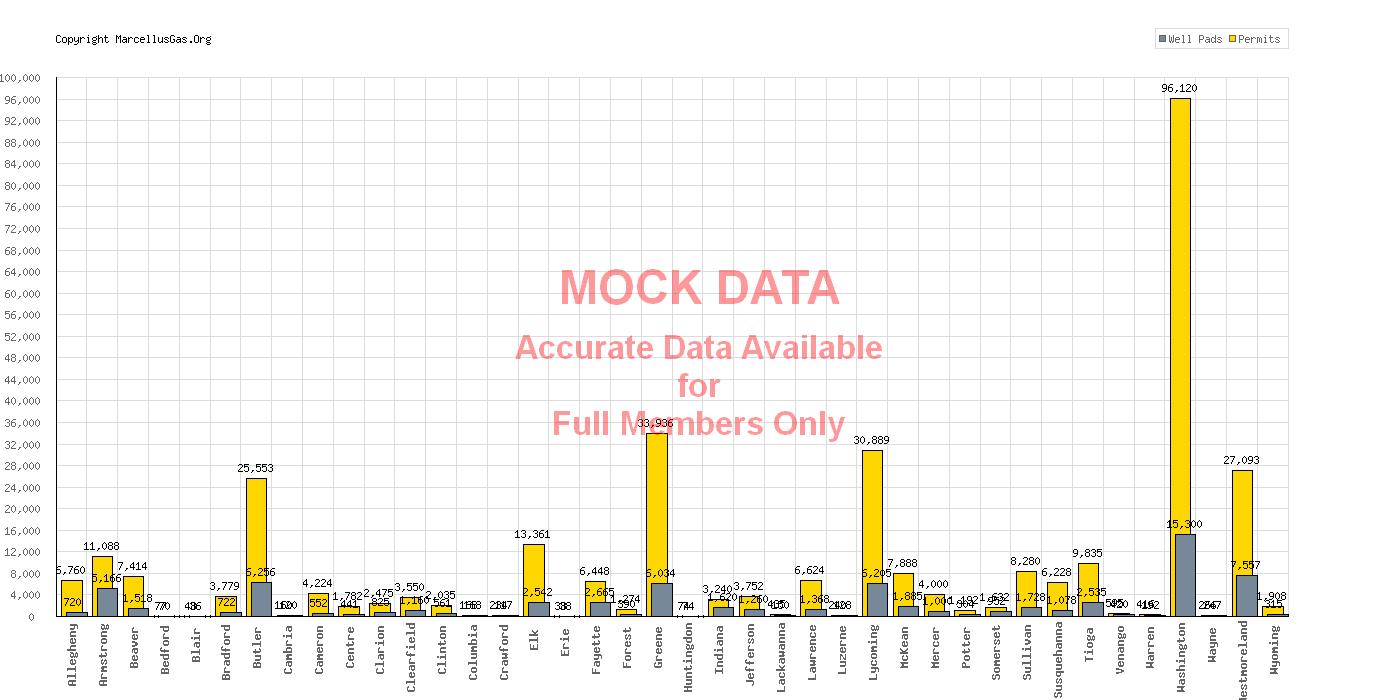
Permitted Unconventional Wells & Well-pads by County for the State of Pennsylvania
: the total number of permitted wells in Pennsylvania to date.
: the total number of permitted well-pads in Pennsylvania to date.
(---) County is the county with the highest number of permitted wells to date ().
|
Graph: Unconventional Well Permits per County for the State of Pennsylvania
|
|
Pennsylvania Counties in Alpabetical Order
|
Based on data from Jul 5th, 2026
© MarcelluGas.Org - All right reserved - Contact MarcellusGas.Org for reprint information.
|
|
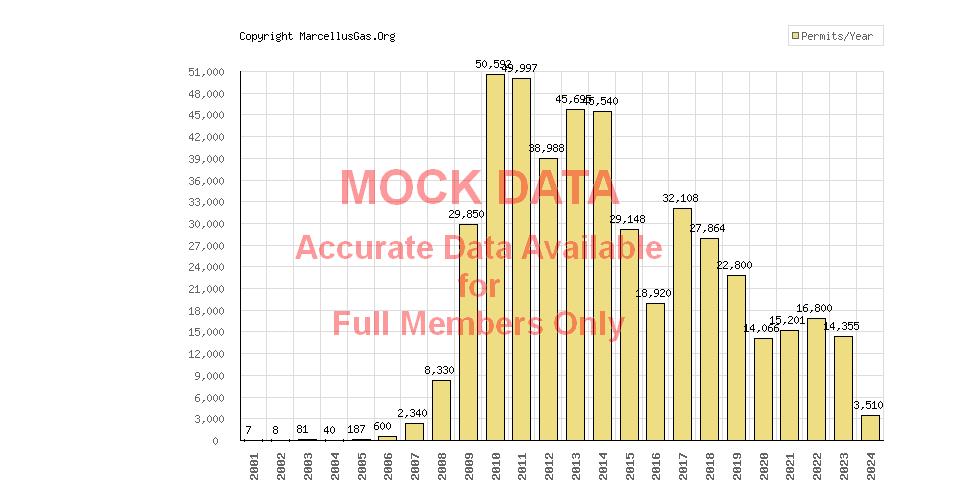
Permitted Unconventional Wells by Year for the State of Pennsylvania
|
Graph: Unconventional Well Permits by Year for the State of Pennsylvania
|
|
Years in chronological order - current year represents permits approved as of Jul 5th, 2026 |
Based on data from Jul 5th, 2026
© MarcelluGas.Org - All right reserved - Contact MarcellusGas.Org for reprint information.
|
|
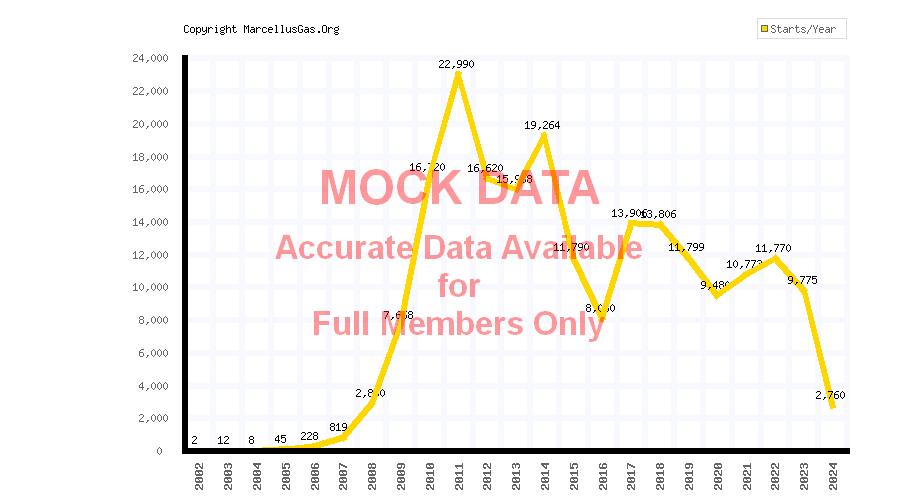
Wells Started by Year for the State of Pennsylvania
|
Graph: Unconventional Well Starts by Year for the State of Pennsylvania
|
|
Years in chronological order - current year represents wells reported as started, as of Jul 5th, 2026 |
Based on data from Jul 5th, 2026
© MarcelluGas.Org - All right reserved - Contact MarcellusGas.Org for reprint information.
|
|
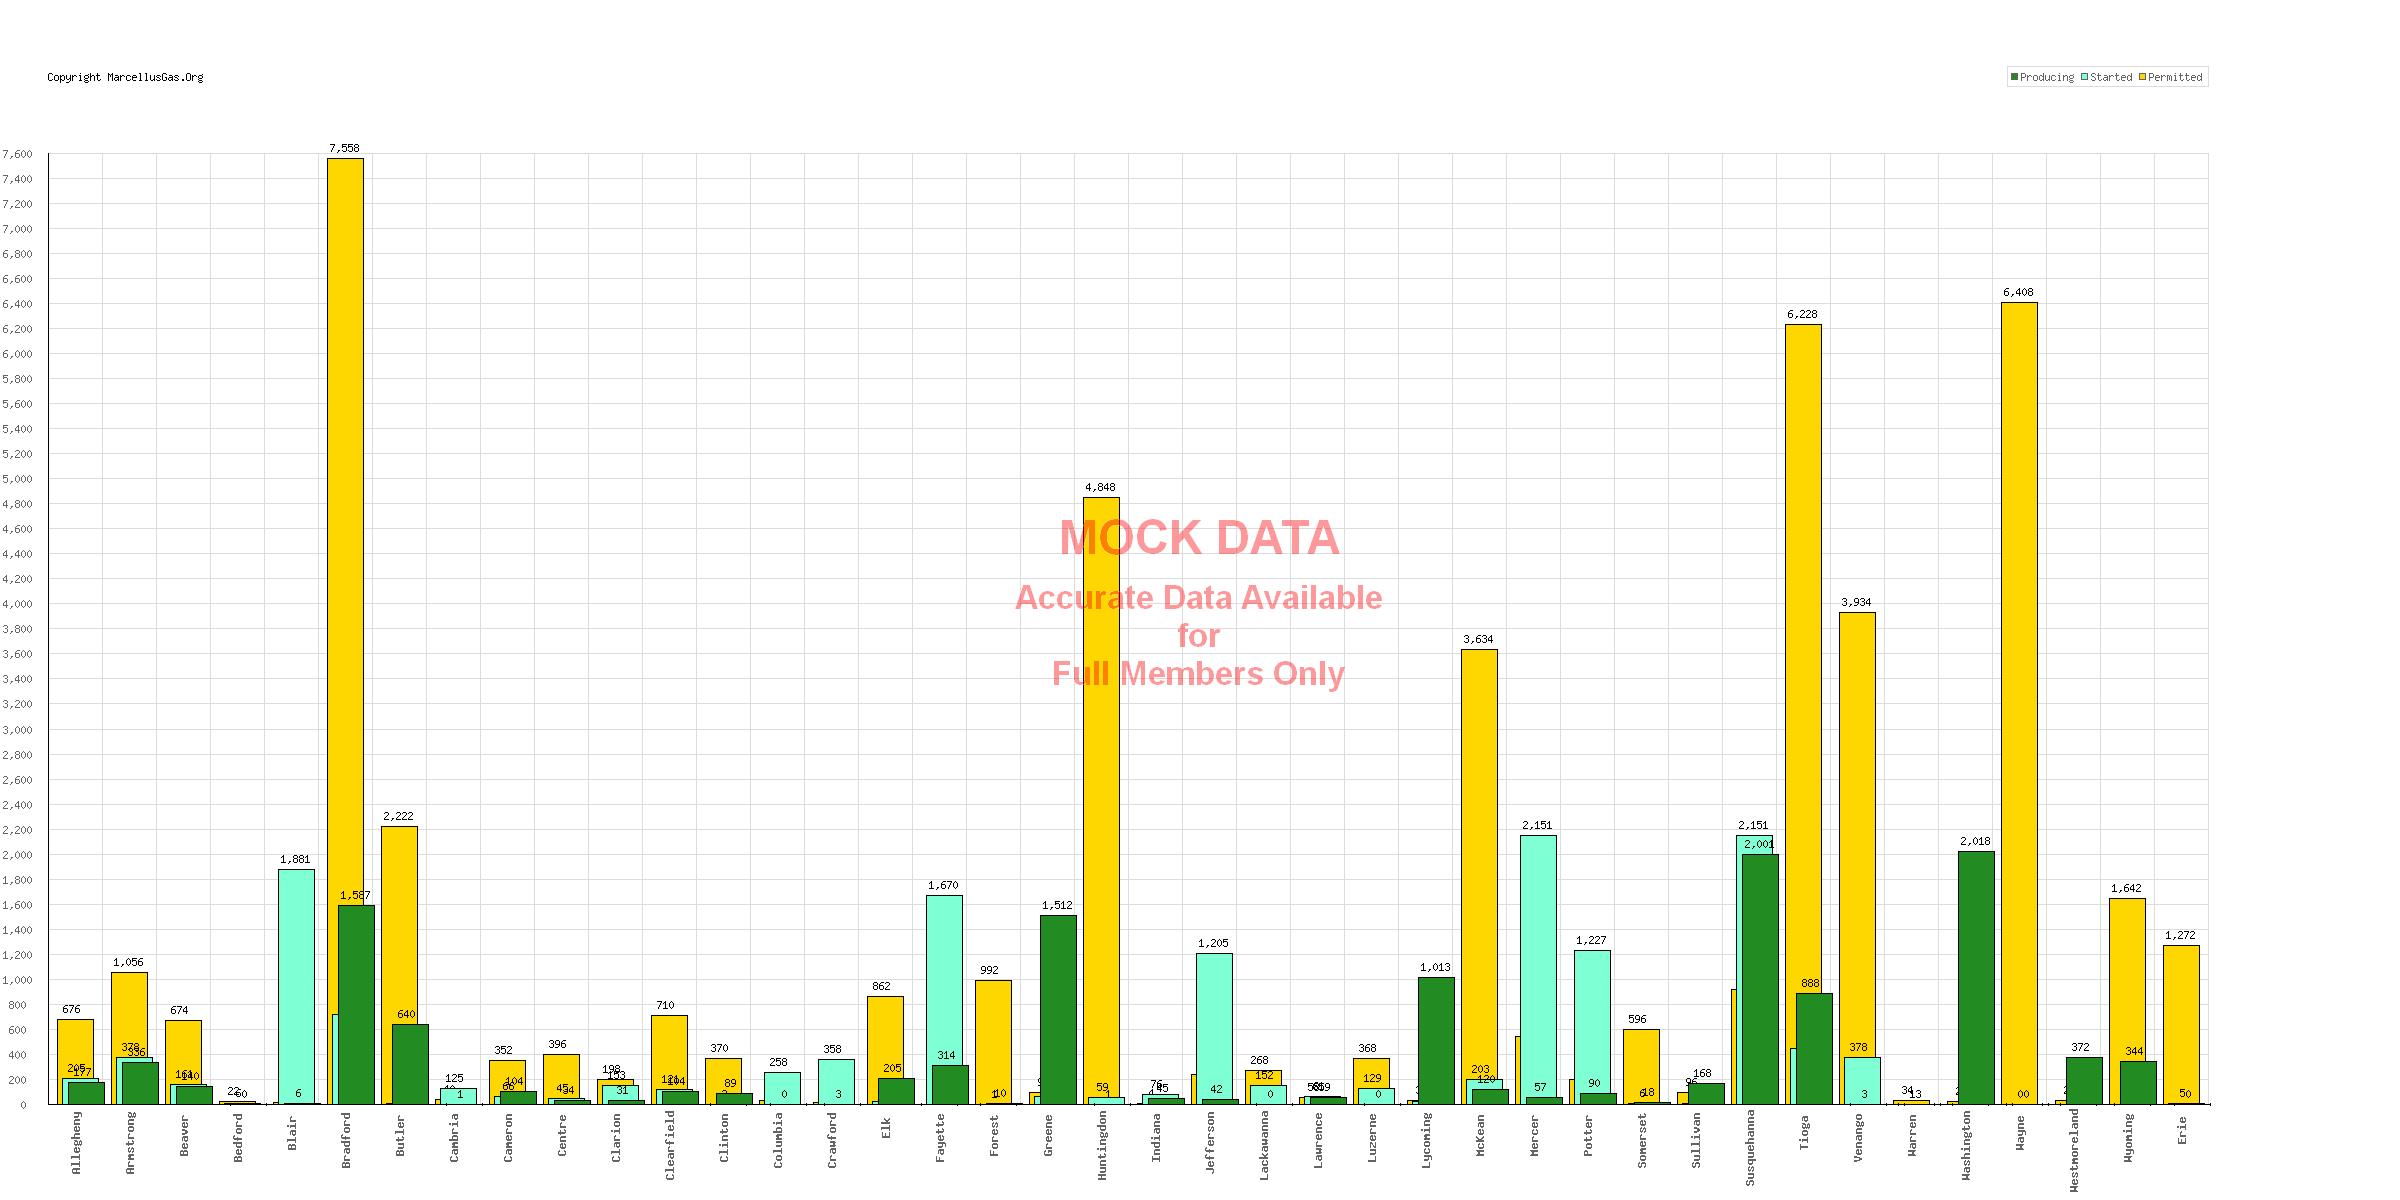
Producing, Started, and Permitted Wells by County for the State of Pennsylvania
|
Graph: Unconventional Well Status: Producing, Started, Permitted - by County for the State of Pennsylvania
|

PA Counties in Alphabetical Order
|
Permitted and Started wells based on DEP data as of Jul 5th, 2026
Producing wells based on DEP data as of Apr 31st, 2026 [DEP data date: 06/18/2026] (most recent available from DEP)
© MarcelluGas.Org - All right reserved - Contact MarcellusGas.Org for reprint information.
|
Gas Company Permits - Statistics for the Entire State of Pennsylvania
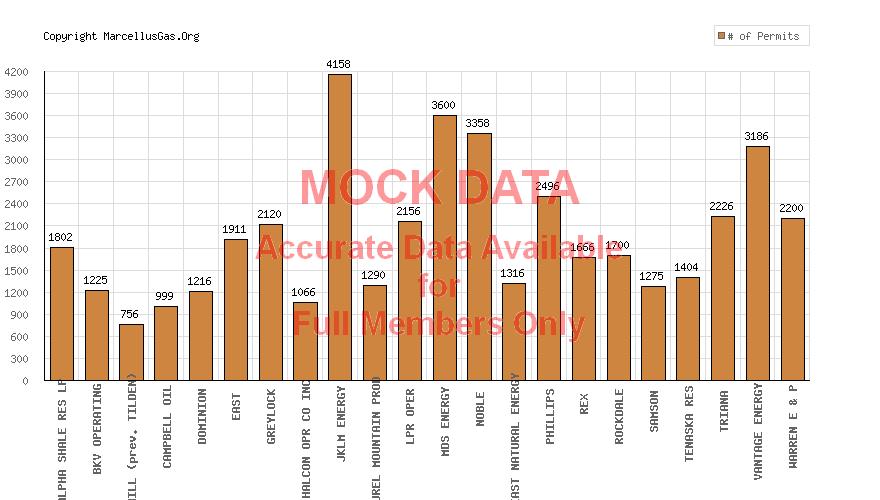
(---): the total number of Gas Companies with approved well permits to date.
(---): Number of Gas Companies with 100 or more approved well permits.
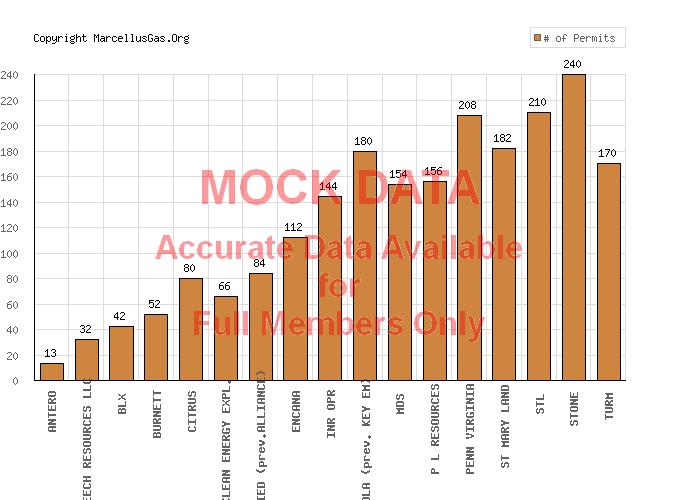
(---): Number of Gas Companies with 20 or more approved well permits.
(---): Number of Gas Companies with 10 or more approved well permits.
(---): Number of Gas Companies with less than 10 well permits.
|
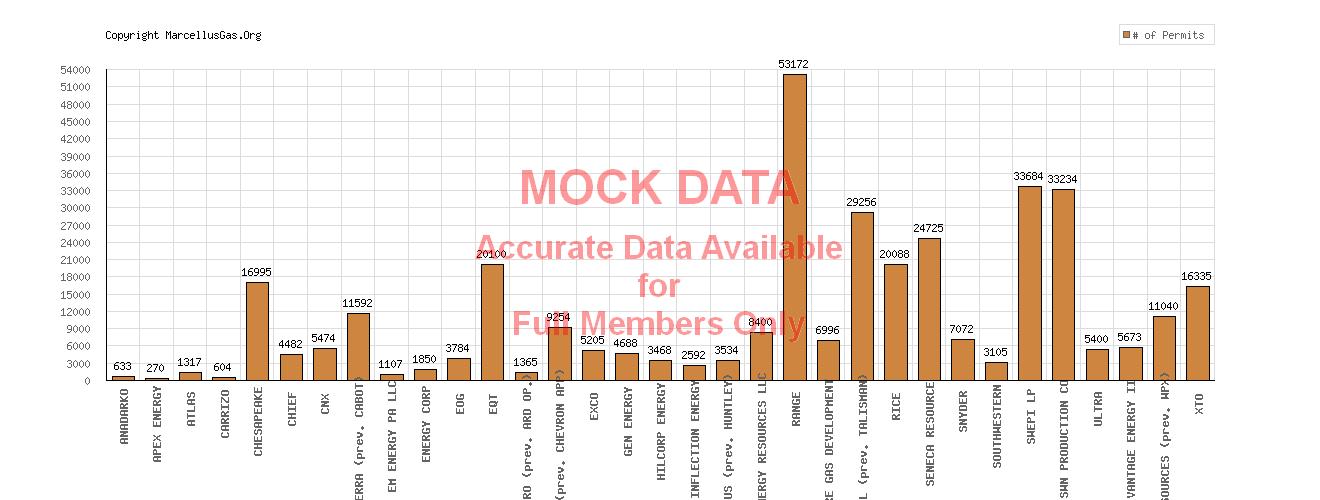
Graph: Gas Companies With 100 or More Approved Unconventional Permits in Pennsylvania
|
|
Gas Companies in Alpabetical Order
|
Based on data from Apr 31st, 2026 [DEP data date: 06/18/2026]
© MarcelluGas.Org - All right reserved - Contact MarcellusGas.Org for reprint information.
|
Graph: Gas Companies with 20 to 99 Approved Unconventional Permits in Pennsylvania
|
|
Gas Companies in Alpabetical Order
|
Based on data from Apr 31st, 2026 [DEP data date: 06/18/2026]
© MarcelluGas.Org - All right reserved - Contact MarcellusGas.Org for reprint information.
|
Graph: Gas Companies with 10 to 19 Approved Unconventional Permits in Pennsylvania
|
|
Gas Companies in Alpabetical Order
|
Based on data from Apr 31st, 2026 [DEP data date: 06/18/2026]
© MarcelluGas.Org - All right reserved - Contact MarcellusGas.Org for reprint information.
|
PA DEP Well Inspections and Cited Violations for the Entire State
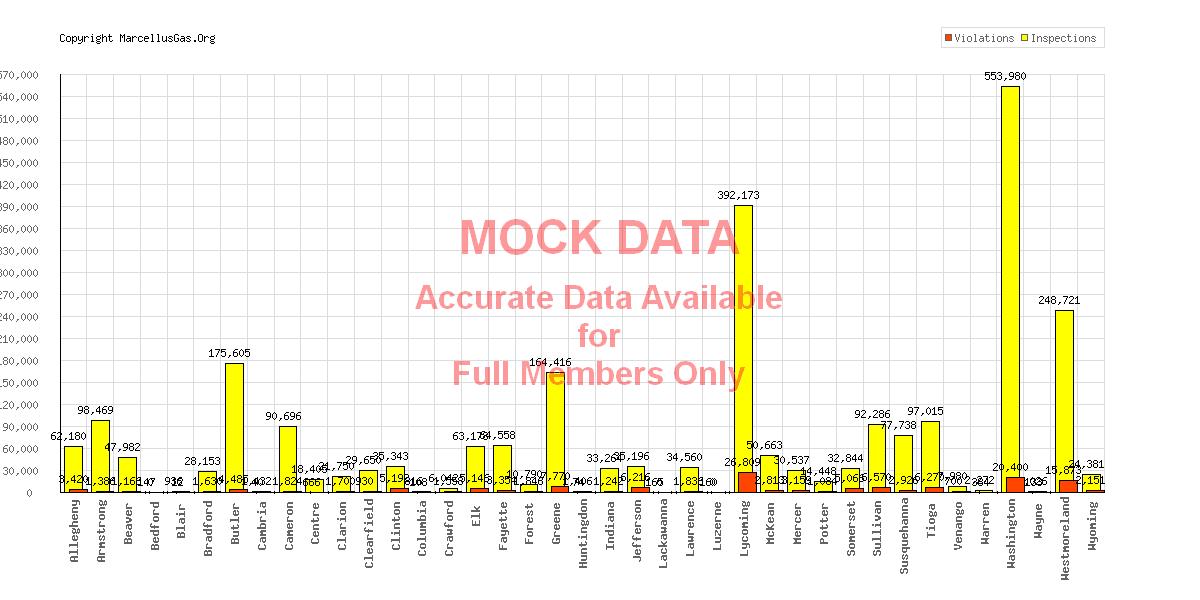
: the total number of inspections reported in Pennsylvania to date.
(---) County is the county with the highest number of inspections to date ((---)).
: the total number of violations reported in Pennsylvania to date.
(---) County is the county with the highest number of violations to date ((---)).
: the total amount of penalties assessed in Pennsylvania to date.
Show/Hide Statistical Criteria
|
Graph: PA DEP Well Inspections and Cited Violations per County for the State of Pennsylvania
|
|
Pennsylvania Counties in Alpabetical Order
|
Based on data from Jul 5th, 2026
© MarcelluGas.Org - All right reserved - Contact MarcellusGas.Org for reprint information.
|
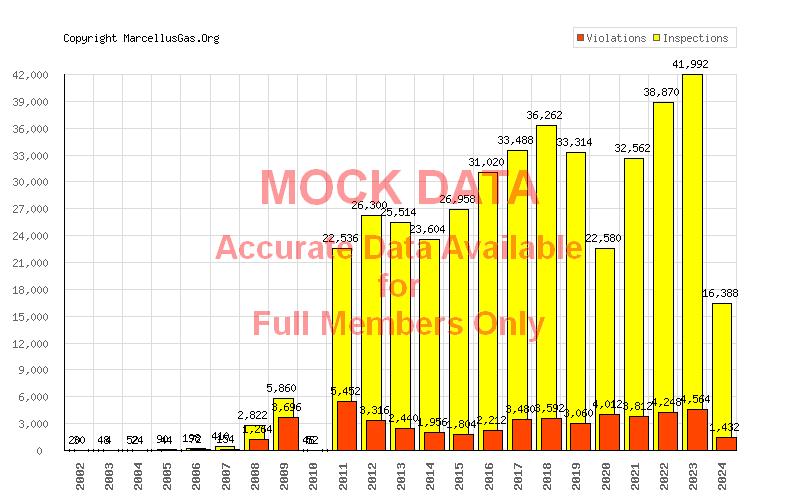
Graph: PA DEP Well Inspections and Cited Violations per Year for the State of Pennsylvania
|
Based on PA DEP compliance data from Jul 5th, 2026
© MarcelluGas.Org - All right reserved - Contact MarcellusGas.Org for reprint information.
|
Graph: PA DEP Well Violations and Number of Penalties Assessed per County for the State of Pennsylvania
 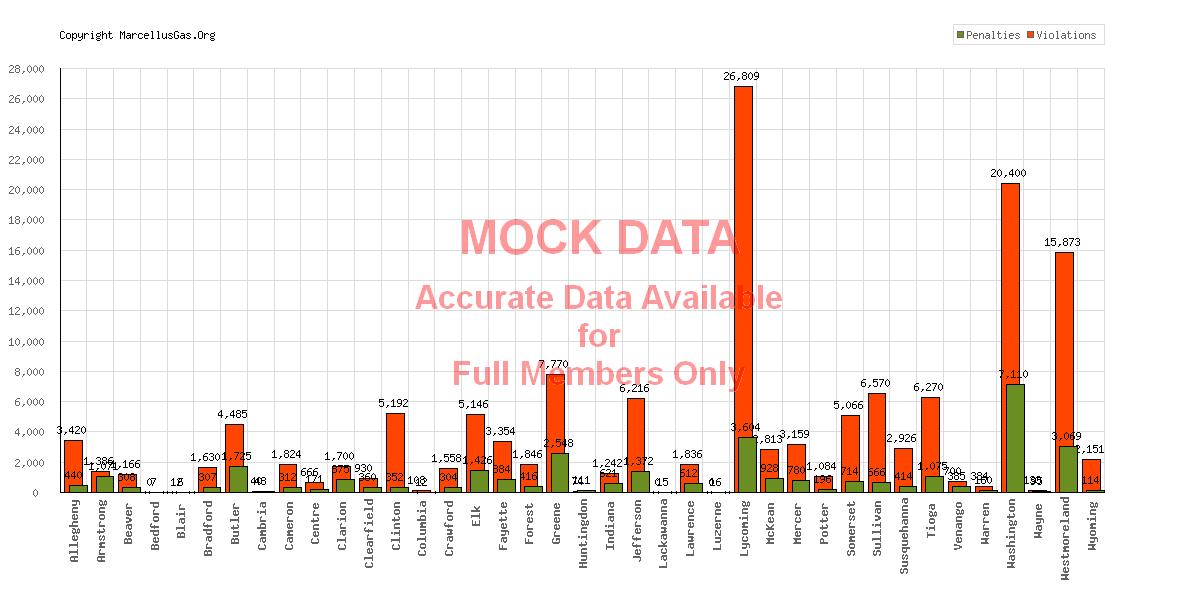
|
|
Pennsylvania Counties in Alpabetical Order
|
Based on data from Jul 5th, 2026
© MarcelluGas.Org - All right reserved - Contact MarcellusGas.Org for reprint information.
|
Graph: PA DEP Total Penalty Fees, in Dollars, per County for the State of Pennsylvania
 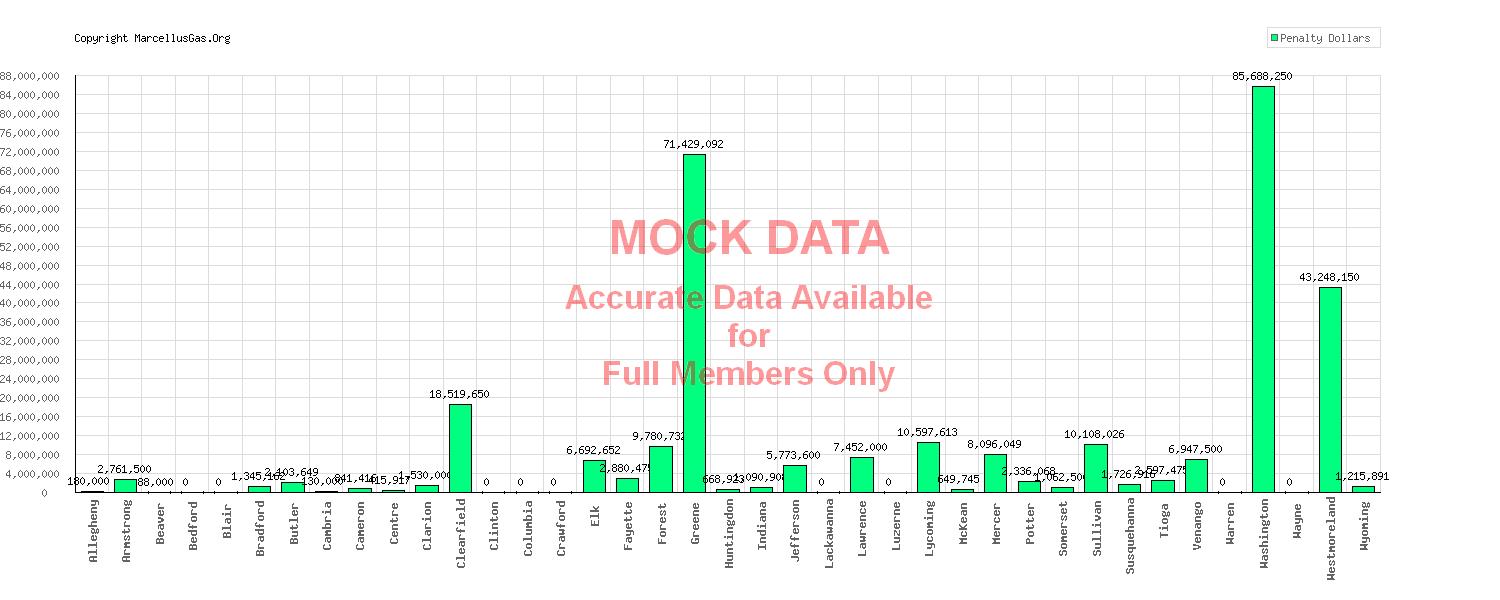
|
Based on PA DEP compliance data from Jul 5th, 2026
© MarcelluGas.Org - All right reserved - Contact MarcellusGas.Org for reprint information.
|
Estimated Anticipated Water Usage (for Hydraulic Fracturing) for Permitted Horizontal Wells for the Entire State
billion gallons: for the entire state of Pennsylvania.
billion gallons: amount if the on-site fracturing fluid was recyled 100%.
: estimated number of 18 wheel tanker truck loads (assuming recycled fracturing fluid).
(---) County is the county with the highest estimated anticipated water usage: billion gallons ( billion gallons if on-site fracturing fluid was recycled 100%).
billion gallons: Mean water flow per day of the Susquehanna river at Towanda, Bradford county
Show/Hide Statistical Criteria
|
Graph: Estimated Anticipated Water Usage (for Hydraulic Fracturing of Permitted Horizontal Wells)
by County for Pennsylvania, in Millions of Gallons per County
 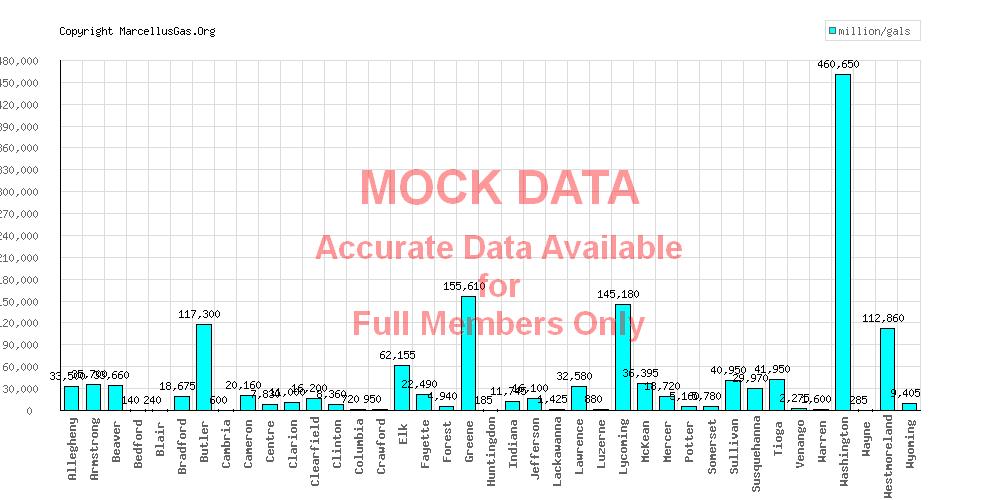
|
|
Pennsylvania Counties in Alpabetical Order
|
Based on data from Jul 5th, 2026
© MarcelluGas.Org - All right reserved - Contact MarcellusGas.Org for reprint information.
|
Graph: Estimated Anticipated Recycled Water Usage (for Hydraulic Fracturing of Permitted Horizontal Wells)
by County for Pennsylvania, in Millions of Gallons per County
 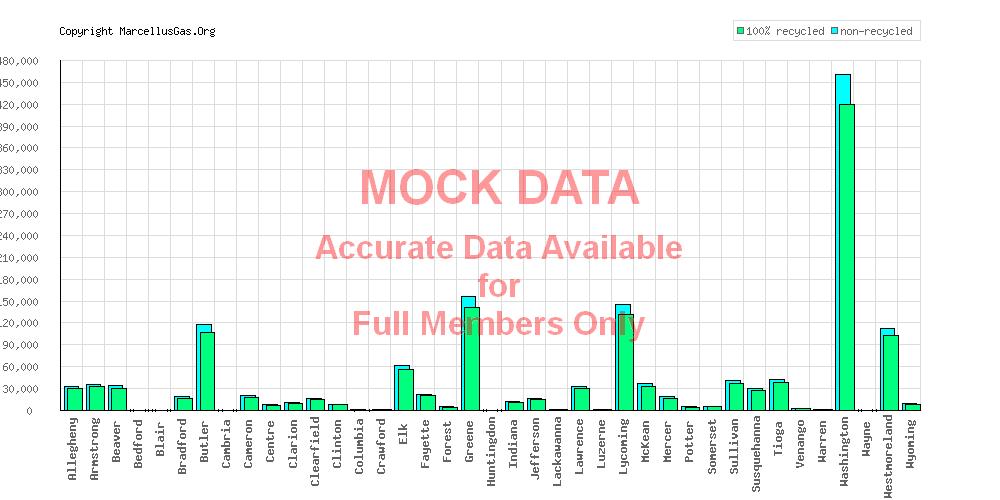
|
|
Pennsylvania Counties in Alpabetical Order
|
Based on data from Jul 5th, 2026
© MarcelluGas.Org - All right reserved - Contact MarcellusGas.Org for reprint information.
|
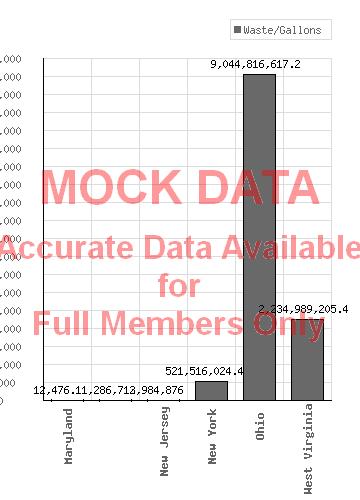
Liquid Waste Hauled From Pennsylvania Unconventional Gas Wells to Out of State Waste Facilities
(---) gallons - total amount of unconventional liquid waste produced in the state of PA
(aproximately 18 wheel tanker truckloads)
(---)% : percentage of liquid waste hauled to PA waste treatment facilities
(---)% : percentage of liquid waste hauled out of state - (---) gallons
(aprxoxmately 18 wheel tanker truckloads)
(---)% : Maryland - percentage of liquid waste sent to Maryland
(---)% : New Jersey - percentage of liquid waste sent to New Jersey
(---)% : Ohio - percentage of liquid waste sent to Ohio
(---)% : West Virginia - percentage of liquid waste sent to West Virginia
Show/Hide Statistical Criteria
|
Graph: Amount, in Gallons, of Liquid Waste Hauled From Pennsylvania Unconventional Gas Wells to Out of State Waste Facilities
|
|
States in Alpabetical Order
|
Based on data from Apr 31st, 2026 [DEP data date: 06/18/2026]
© MarcelluGas.Org - All right reserved - Contact MarcellusGas.Org for reprint information.
|
Distributed Act 13 Impact Fee Revenue per County for the State of Pennsylvania
|
|
Graph: Act 13 County Distributed Impact Fee Revenue - by County for the State of Pennsylvania
|
Revenue displayed in the graph below is "county only" and does not include
any revenue distributed to townships within the county
Only counties with active/unconventional gas wells are displayed
|
Graph legend:
|

|
|
|
Pennsylvania Counties in Alpabetical Order
|
Based on Pennsylvania PUC data as of Jul 5th, 2026
© MarcelluGas.Org - All right reserved - Contact MarcellusGas.Org for reprint information.
|
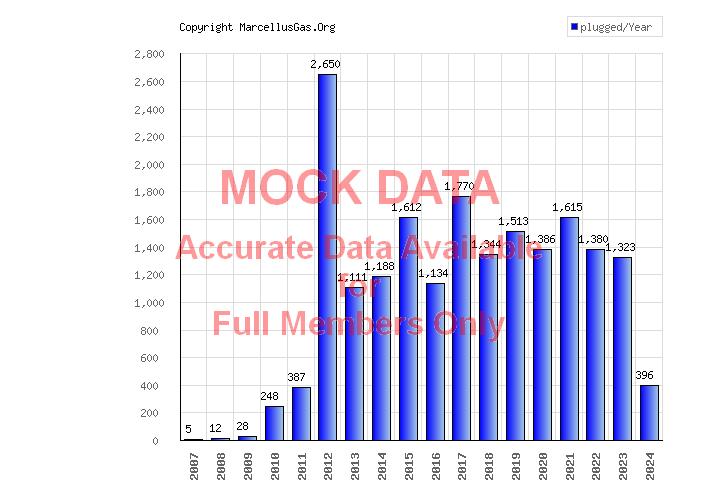
Number of Plugged Wells by Year - Entire State of Pennsylvania
|
|
Based on data from Jul 5th, 2026
© MarcelluGas.Org - All right reserved - Contact MarcellusGas.Org for reprint information.
|
Estimated DEP Permit Fees by County for the State of Pennsylvania
: total estimated DEP permit fees in Pennsylvania to date.
County is the county with the highest estimated DEP permit fees to date ().
Show/Hide Statistical Criteria
|
Graph: Estimated DEP Permit Fees per County for the State of Pennsylvania
|
|
Pennsylvania Counties in Alpabetical Order
|
Based on data from Jul 5th, 2026
© MarcelluGas.Org - All right reserved - Contact MarcellusGas.Org for reprint information.
|
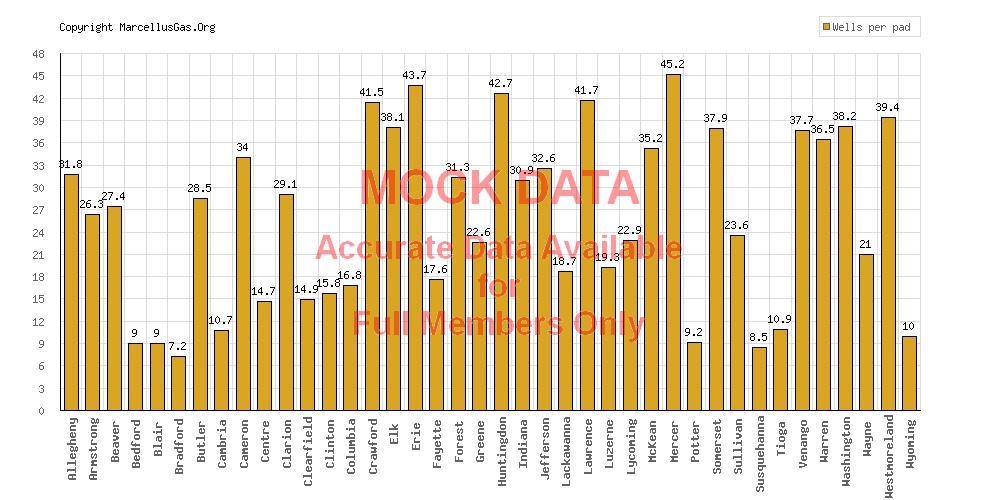
Average Number of Wells per Well Site by County for Pennsylvania
(---): Highest number of individual wells permitted at a single well site.
Wellsites with (---) permitted wells: (---)
|
Graph: Estimated Average Number of Permitted Wells per Well Site per County for Pennsylvania
|
|
Pennsylvania counties in alpabetical order - only well-pads with multiple wells considered.
|
Based on data from Jul 5th, 2026
© MarcelluGas.Org - All right reserved - Contact MarcellusGas.Org for reprint information.
|
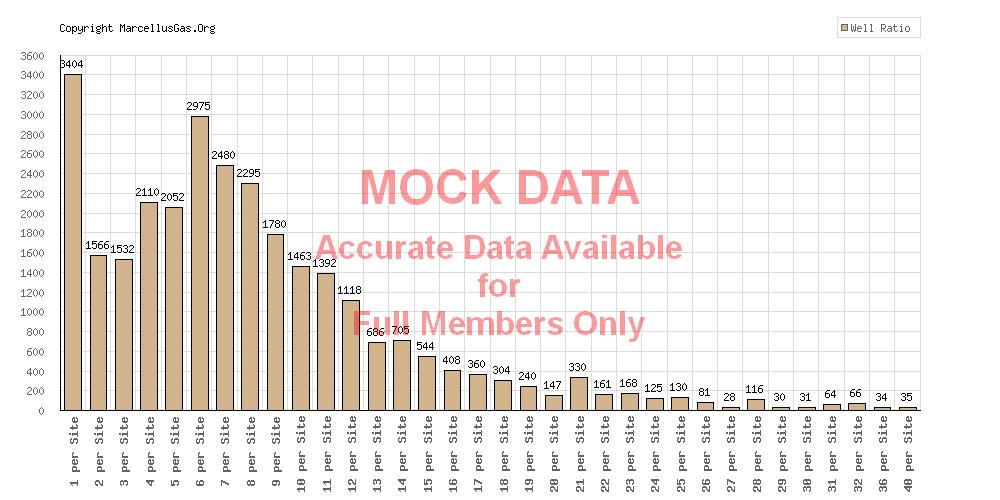
Graph: Well Sites Grouped by Equal Number of Permitted Wells per Site (Entire State of Pennsylvania)
|
|
Most Common Number of Wells per Site to Least Common Number of Wells per Well Site
|
Based on data from Jul 5th, 2026
© MarcelluGas.Org - All right reserved - Contact MarcellusGas.Org for reprint information.
|
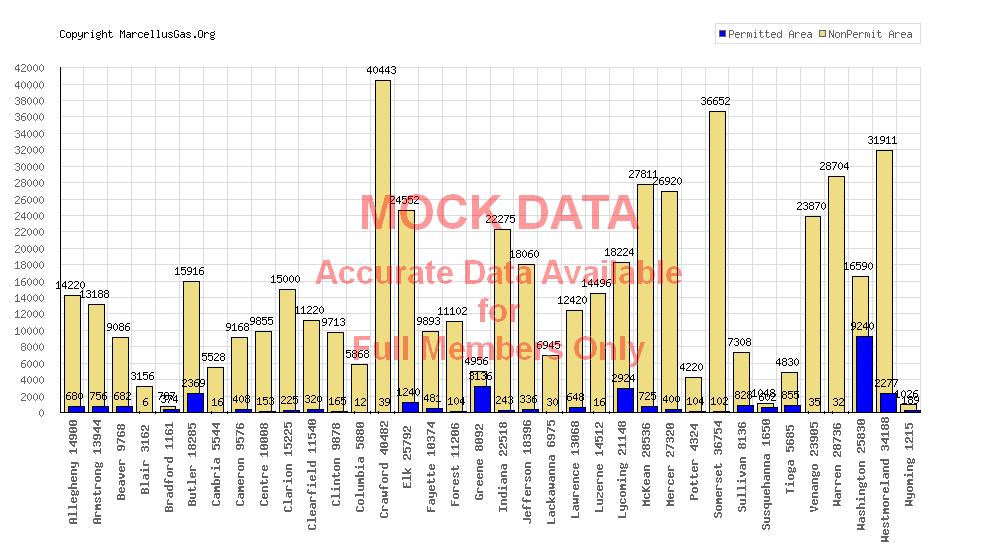
Estimated Gas Extraction Area (Sq/Mi) for Permitted Unconventional Wells in Pennsylvania
(---) Square Miles: Total surface area of Pennsylvania counties that currently have well permits.
(---) Square Miles: Total estimated "extraction footprint" permitted in those counties.
(---)% : Percentage of available surface area covered by permitted "extraction footprints".
(---) Years : Estimated timeframe when all available extraction area will be permitted.
Show/Hide Statistical Criteria
|
Graph: Estimated Permitted Gas Extraction Area (Sq/Mi) Compared to Non-Permitted Area, by County in Pennsylvania (Unconventional Wells)
|
|
Counties (and the county total area) in Alpabetical Order
|
Based on data from Apr 31st, 2026 [DEP data date: 06/18/2026]
© MarcelluGas.Org - All right reserved - Contact MarcellusGas.Org for reprint information.
|
|
|
|