MarcellusGas.Org
Become A Member
|
Sign-In
|
View Cart
|
Your Account
|
Home
Permit Information Updated
Jul 11th, 2026
Information Related to Pennsylvania Deep Gas Well Activity
Home
FREE Guest Membership
+
How To Use This Site
»
Locate A Well
»
Detailed Well Reports
»
Drilling Maps
»
Well Packets
»
Frac Fluid Reports
+
Membership Information
»
Full Membership Sign Up
»
Membership Benefits
»
Your Account Information
Royalty/Production Calculator
NEW: Royalty Well Head Pricing Averages
+
Well Watch: Alerts & Reports
»
Sign up for Well Watch Alerts
»
Recent Events Reports
+
Record Setting Wells
»
Record Setting Well-Pads
»
Record Setting Wells
Recent Production Reports
Township/County History Reports
Permit to Production Time Line Reports
+
Impact Fee Reports
»
Detailed Township Reports
»
Comparative Township Revenue Reports
+
Gas Company Information
»
Record Setting Gas Companies
»
Violation Reports
»
General Information
+
Graphs and Statistics
»
All
»
by State
»
by County
»
by Township
Compressor Facility Information
Waste Facility Information
Tainted Water Well Reports
State Maps
Contact MarcellusGas.Org
About MarcellusGas.Org
Related Sites & Links
Privacy Policy
Terms Of Use
State Maps Displaying Marcellus Gas Well Information
Timeline Permit Slideshow
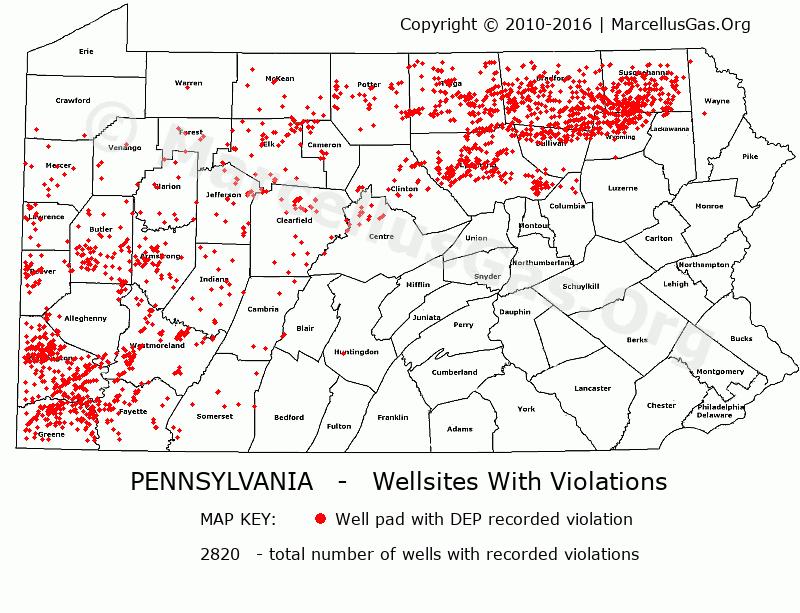
Wells With Reported Violations
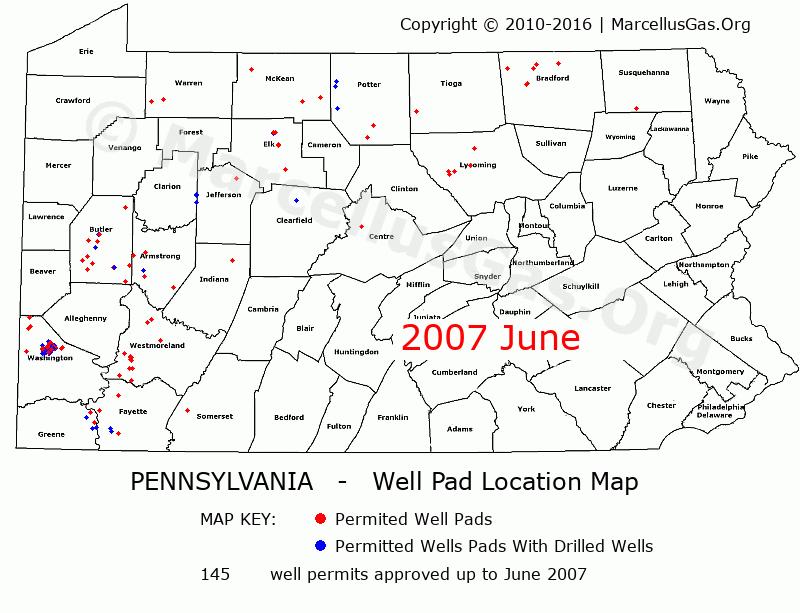
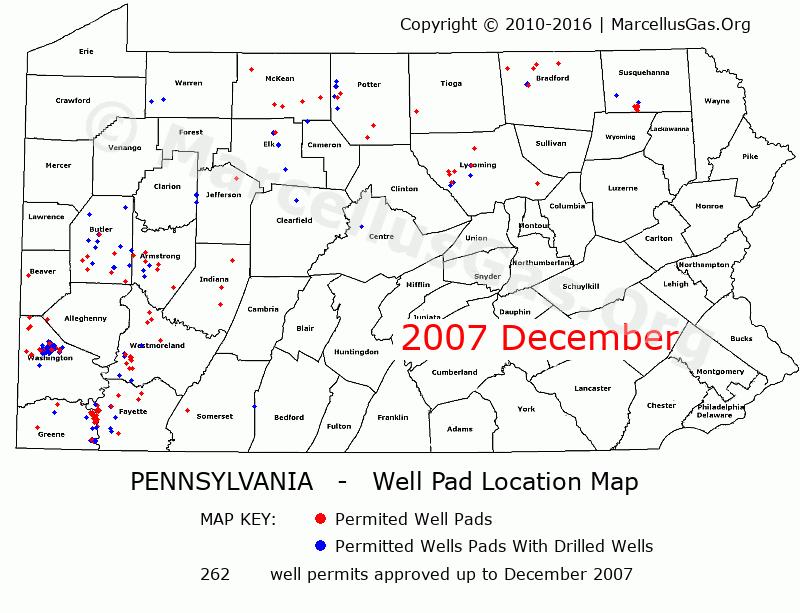
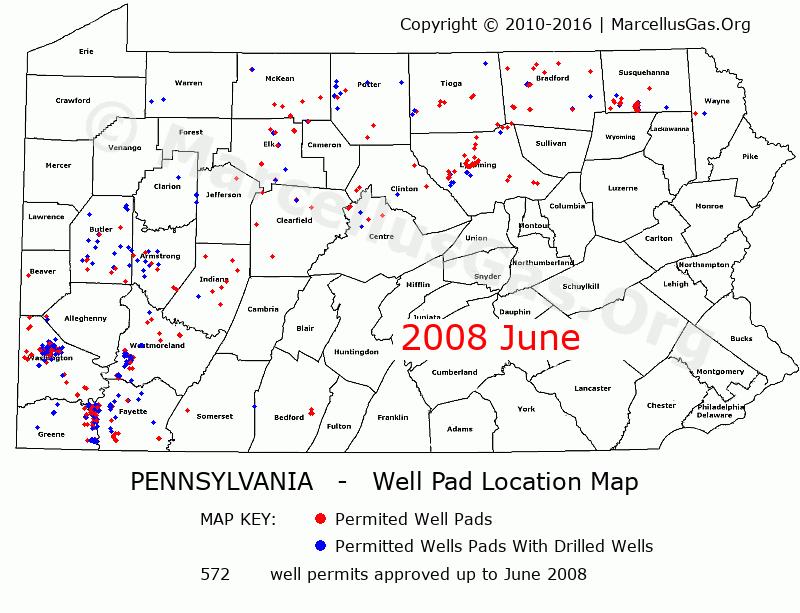
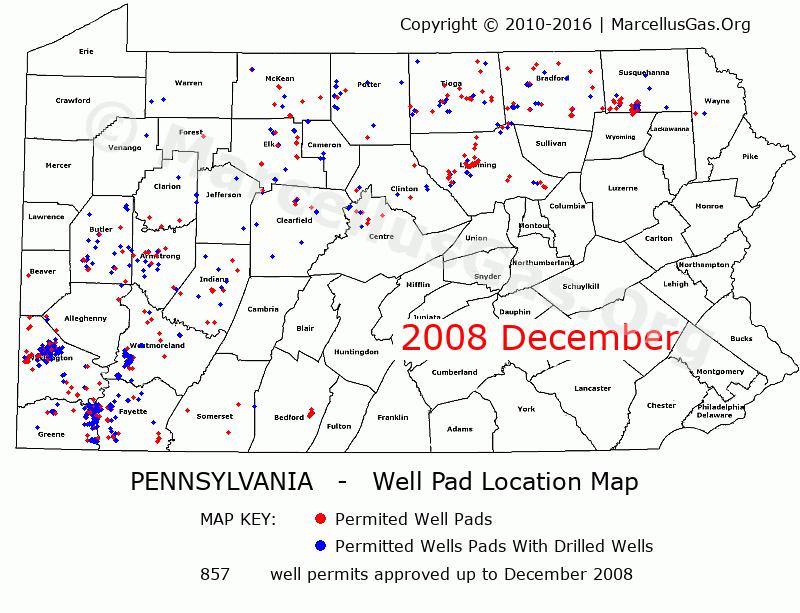
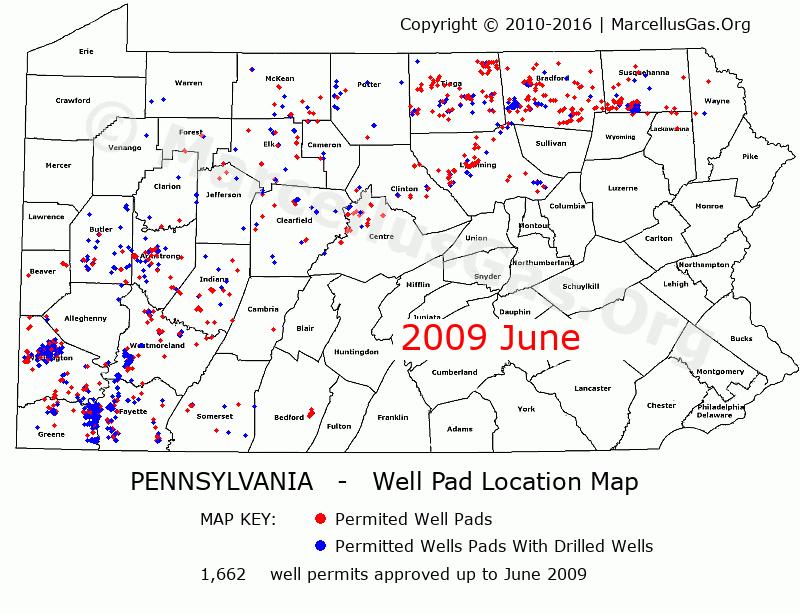
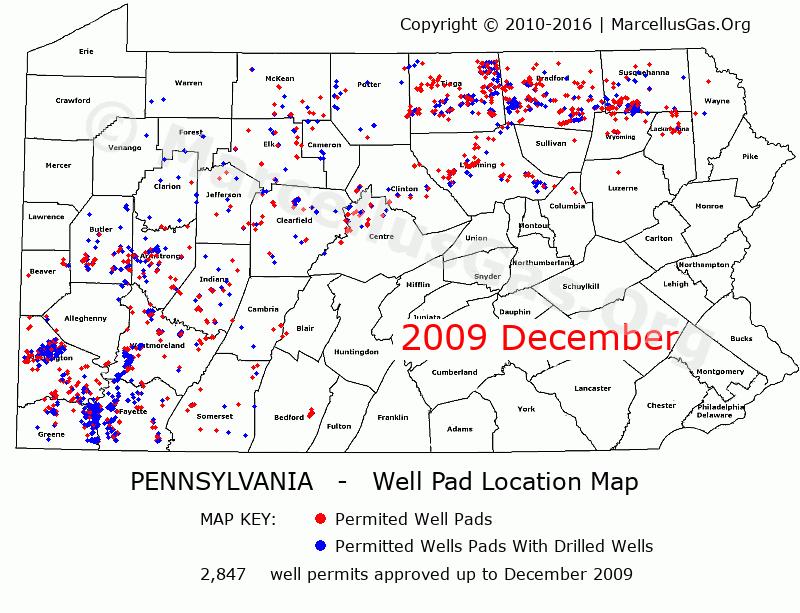
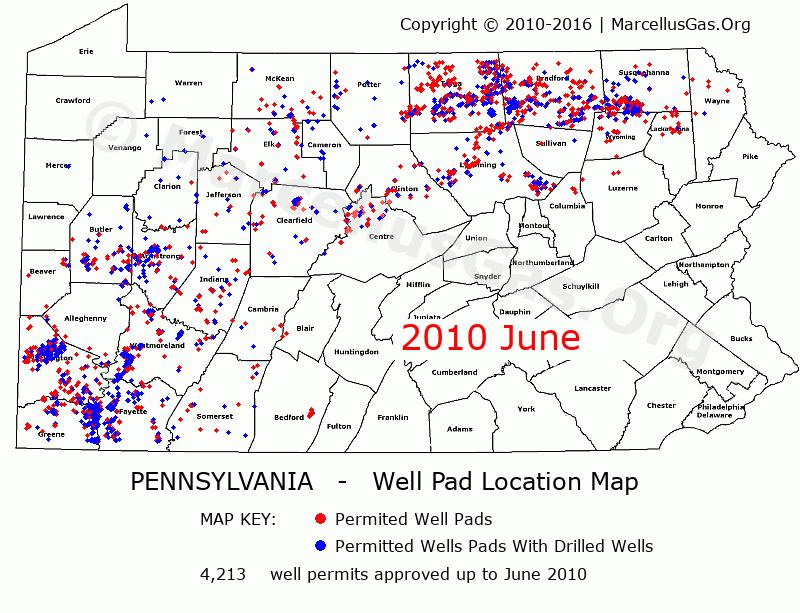
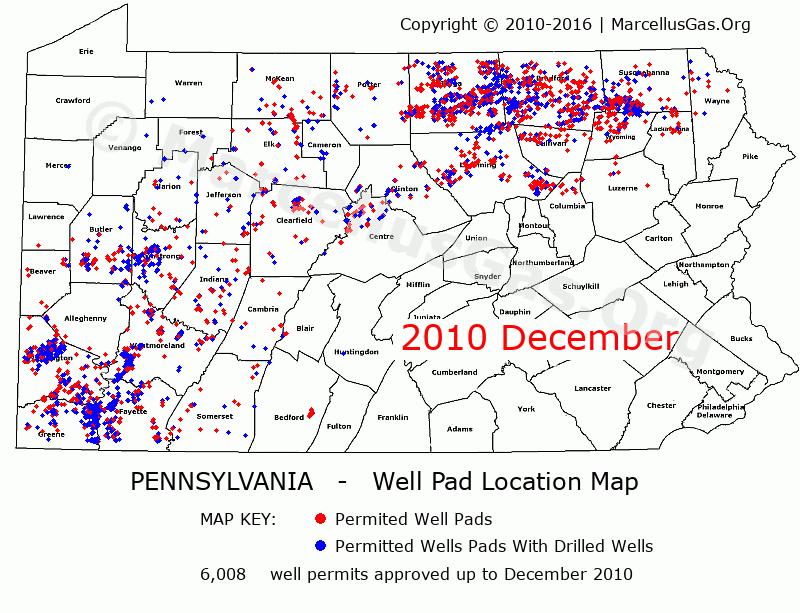
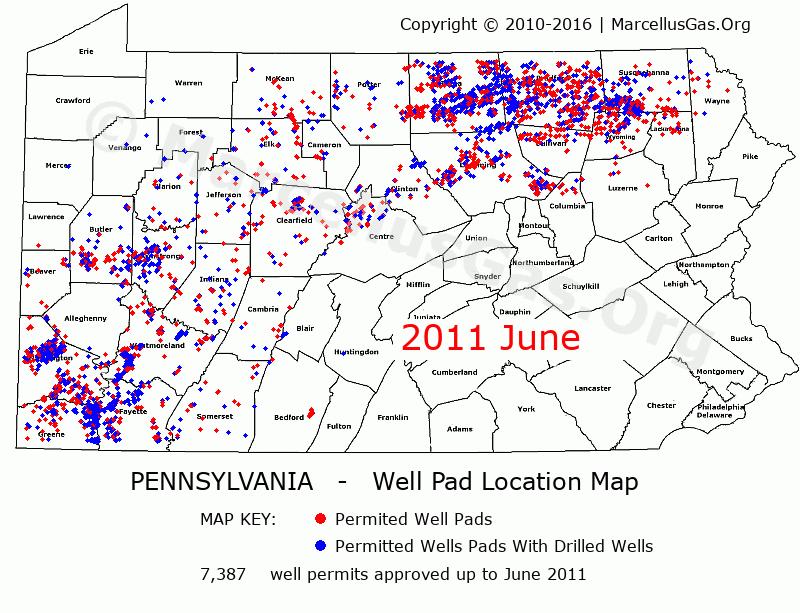
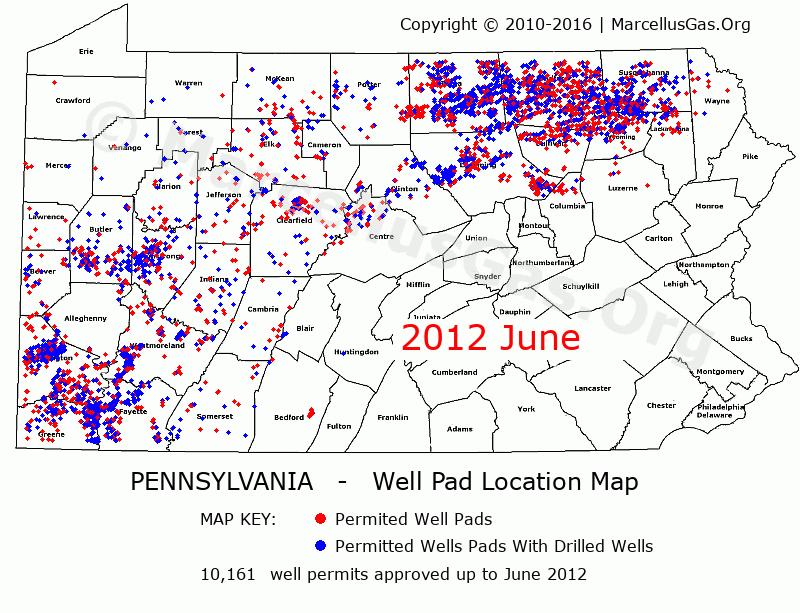
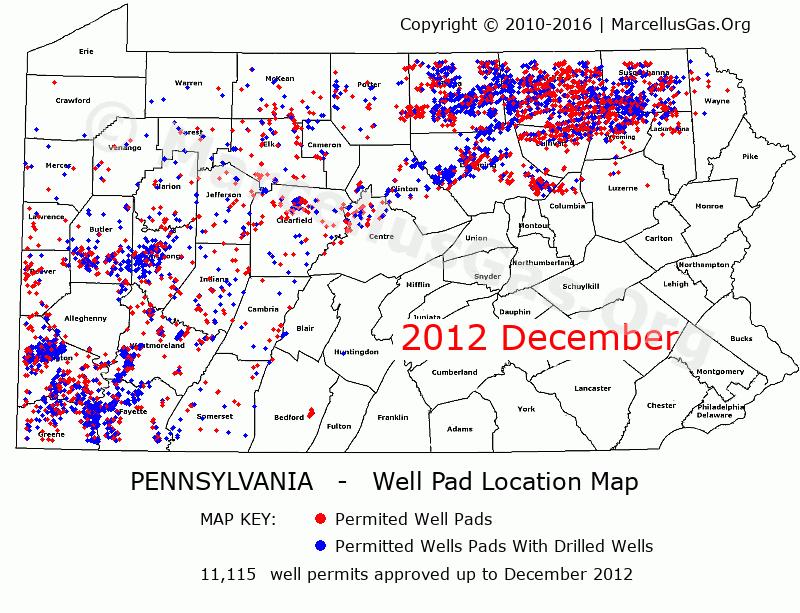
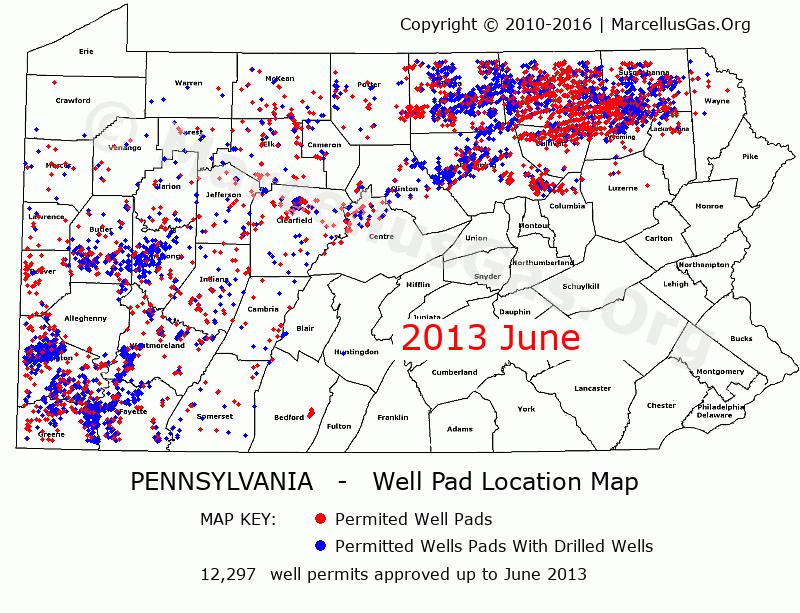
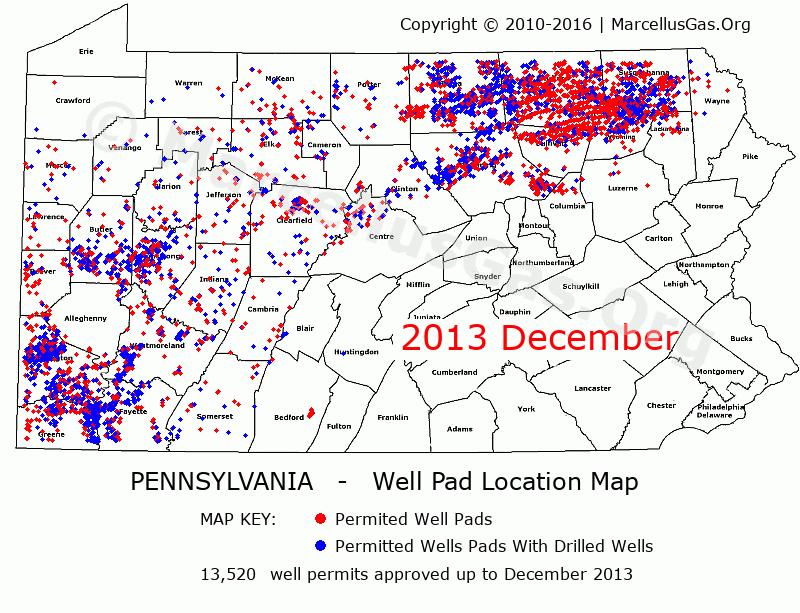
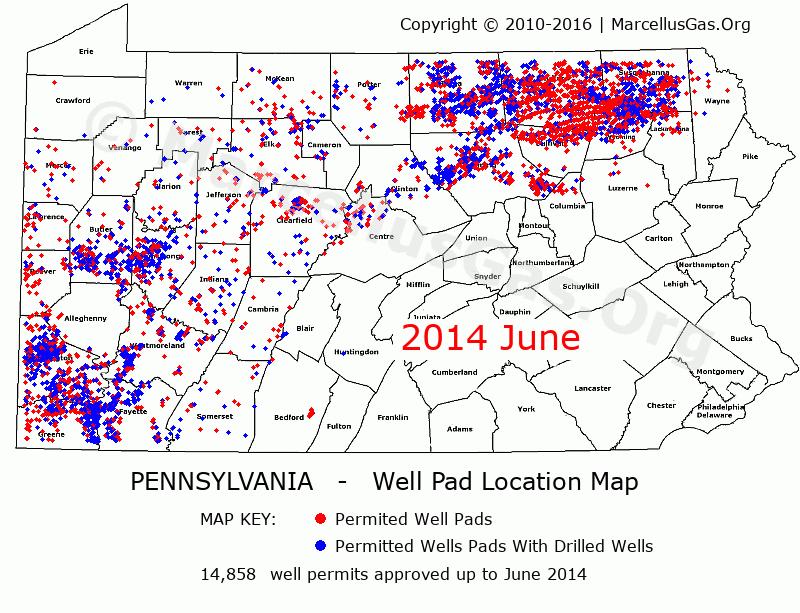
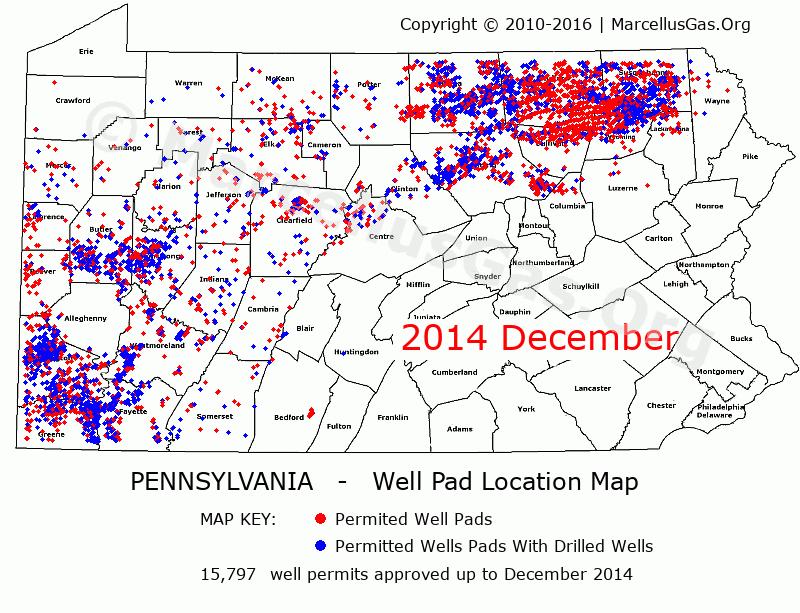
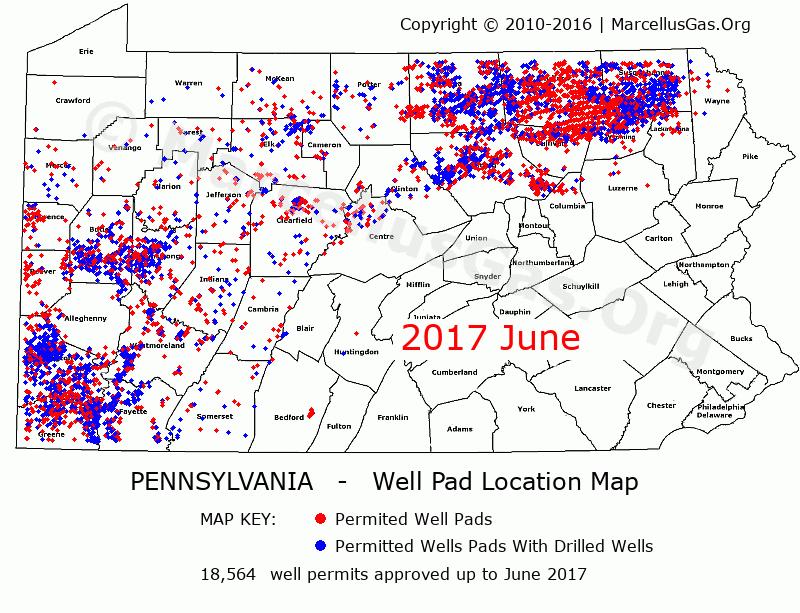
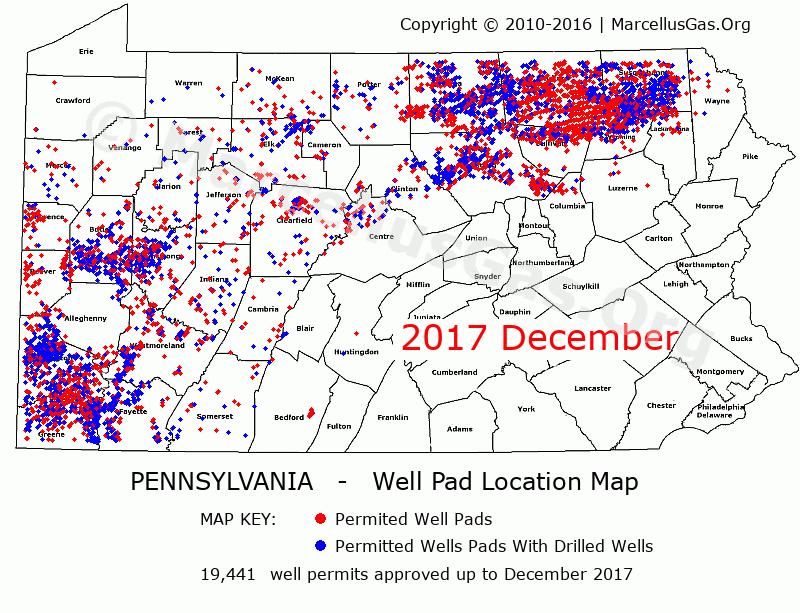
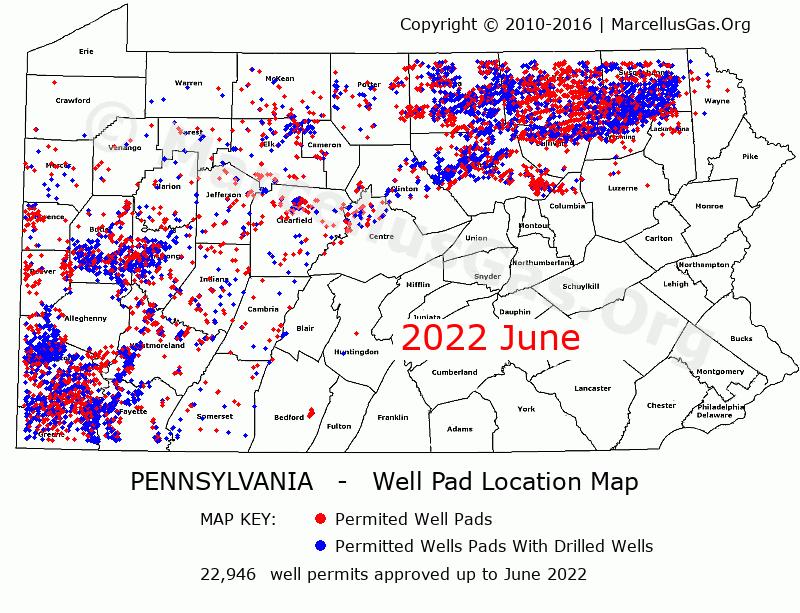
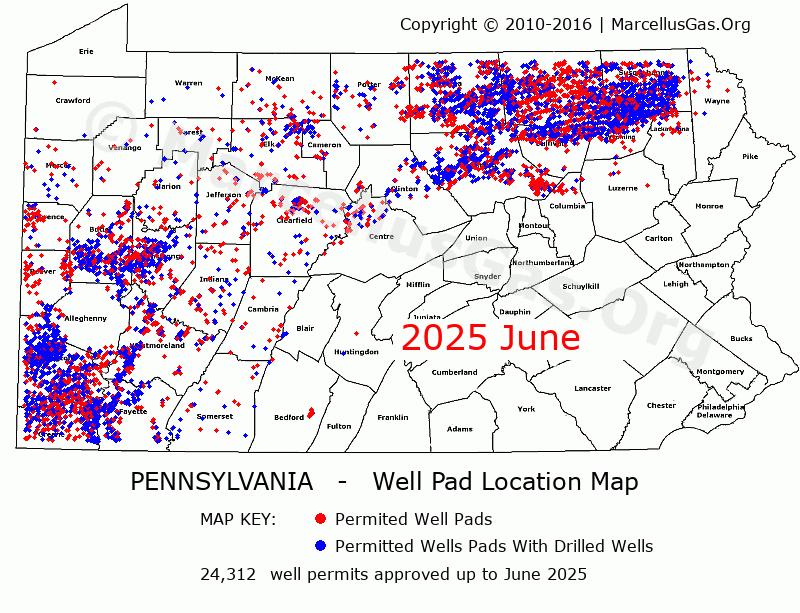
Timeline Map of Permitted Wellsites in the State of Pennsylvania
6 Month Intervals from June 2007 through Jul 11th, 2026
Click date or map icon below to view full size map for a given time period
2007 JUN
2007 DEC
2008 JUN
2008 DEC
2009 JUN
2009 DEC
2010 JUN
2010 DEC
2011 JUN
2011 DEC
2012 JUN
2012 DEC
2013 JUN
2013 DEC
2014 JUN
2014 DEC
2015 JUN
2015 DEC
2016 JUN
2016 DEC
2017 JUN
2017 DEC
2018 JUN
2018 DEC
2019 JUN
2019 DEC
2020 JUN
2020 DEC
2021 JUN
2021 DEC
2022 JUN
2022 DEC
2023 JUN
2023 DEC
2024 JUN
2024 DEC
2025 JUN
2026 Jul
Location of Wellsites With Recorded Violations in the State of Pennsylvania
(Jul 11th, 2026)
© MGOrg - MarcellusGas.Org 2010-2026.
Contact MGOrg
||
Terms Of Use